
By Lois Salem, 3rd year PhD
I look at the chemistry of crystals and their melt inclusions to understand how the mantle melts, how different processes affect the melt such as crystallisation, exsolution, diffusion and mixing, and model their chemical signature to inform our understanding of how and why volcanoes erupt. In particular my PhD focusses on basaltic volcanoes with Oceanic Island Basalt chemical signatures with case studies of Kilauea, Hawaii and Mt Etna, Sicily.
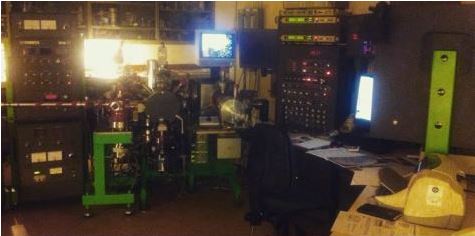
The sample preparation and data collection are the real nitty-gritty aspects of the science, far less pleasurable than sample collection in Hawaii (surprise surprise!). However, good data collection is incredibly important and my week at the NERC ion probe facility in Edinburgh taught me just how sensitive analyses are to the temperament of the machine (Cameca ims-4f), how calibration is the key and well characterised Standards are your friends in times of need.
It’s 2am. Mid-week, with still 3 days of analysis time left to endure. Endure is the correct word, I’m not just being negative. Endure because data collection is pretty monotonous and pressing a few buttons at ten and thirty minute intervals is not only quite dull but those particular timings are not conducive too concentrating on any other PhD task particularly well. I have however been analysing my data as it is churned out, and that has been pretty exciting.
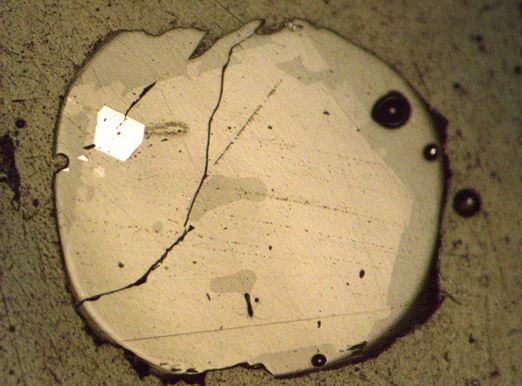
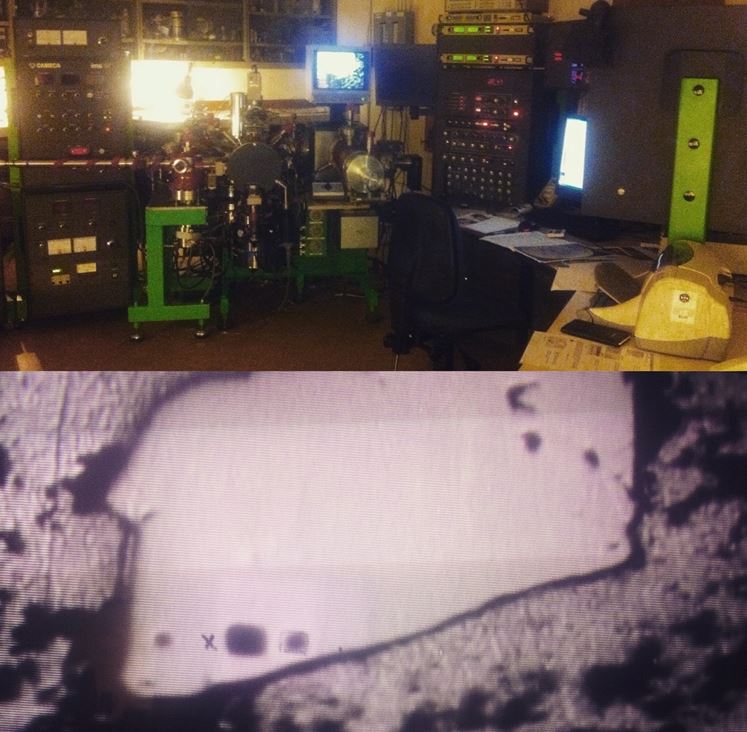
The samples we have are from Kilauea, Hawaii. They are from an effusive eruption that coincided with a surge of primitive melt from the mantle into the lower crust as suggested by geophysical monitoring system at the Hawaiian Volcano Observatory. I have taken samples from the quenched crust of the lava flow in the hope that this is where the crystals cooled fastest and didn’t continue to fractionate the chemistry of the melt. I crush the samples to 1-2mm size fraction and hand pick olivine crystals containing glassy melt inclusions. Any bubbles or fluid trapped in olivine crystal as fluid inclusions or in the MIs as shrinkage bubbles, formed during changes in pressure and exsolution of volatiles, are measured by Raman spectroscopy before the olivines are all individually polished to expose the melt inclusion at the surface. We can then analyse the glassy melt inclusions for trace and volatile elements (CO2 and H2O) by Secondary Ion Mass Spectrometry (SIMS). Back in Cambridge I will use Electron Microprobe Analysis (EMPA) to measure major elements, S and halogens and normalise my melts to their individual Si contents.
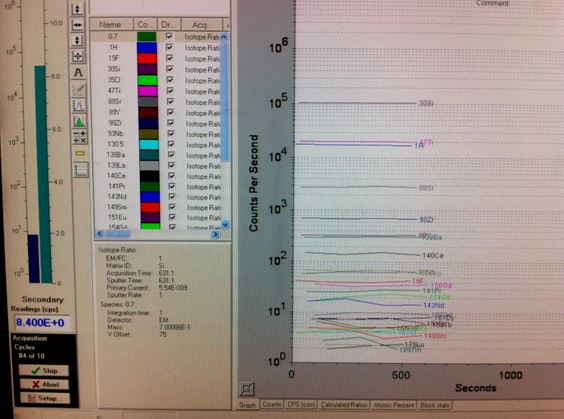
SIMS is a technique involving the bombardment of a solid sample by a focussed beam of primary ions (Cs+, O+, Os or Ar+) under vacuum. The collision results in ejection and ionisation of atoms from the surface of the sample and these secondary ions are then accelerated into a mass spectrometer where they are separated according to their energy and mass/charge ratio. They are then detected by electron multipliers or Faraday cups. The sample is imaged and set up for particular trace element, C and H ion mass peaks and the counts recorded by the Faraday Cups are used as an ionic mass ratio to determine the equivalent concentration of a species. The analysis is on a small area, just a few microns, so it is a perfect technique for chemical analysis of melt inclusions.
Our preliminary results suggest the melts are quite degassed, which is problematic for modelling pressure constraint using CO2 and H2O concentrations, as the pressure calculated will be a minimum. This, however, is just an initial musing from half a week of data, perhaps more mysteries will be unlocked later in the week and in the following months as I model which processes fractionate the chemistry using the data from my natural samples. It’s an exciting technique as you never know what these micron-scale pockets of melt will reveal about the depths of the earth and how we might push forward the frontiers of the science. Stay tuned for our findings which will be presented at AGU this year!